InsightLabyrinth is a document transformation platform that turns raw, unstructured files into structured business outputs. The starting point was a wizard shell with the right visual structure but no intelligence behind it: static previews that didn't change regardless of what you uploaded, and AI refinement options that were cosmetic. This project replaced those placeholders with four working features: extraction confidence scoring, schema mapping, a multi-phase processing view, and an entity graph that reflects the actual content of the uploaded file.
Year
06.25
Scope
AI Integration, Rapid Prototyping
Timeline
1 week

The Audit
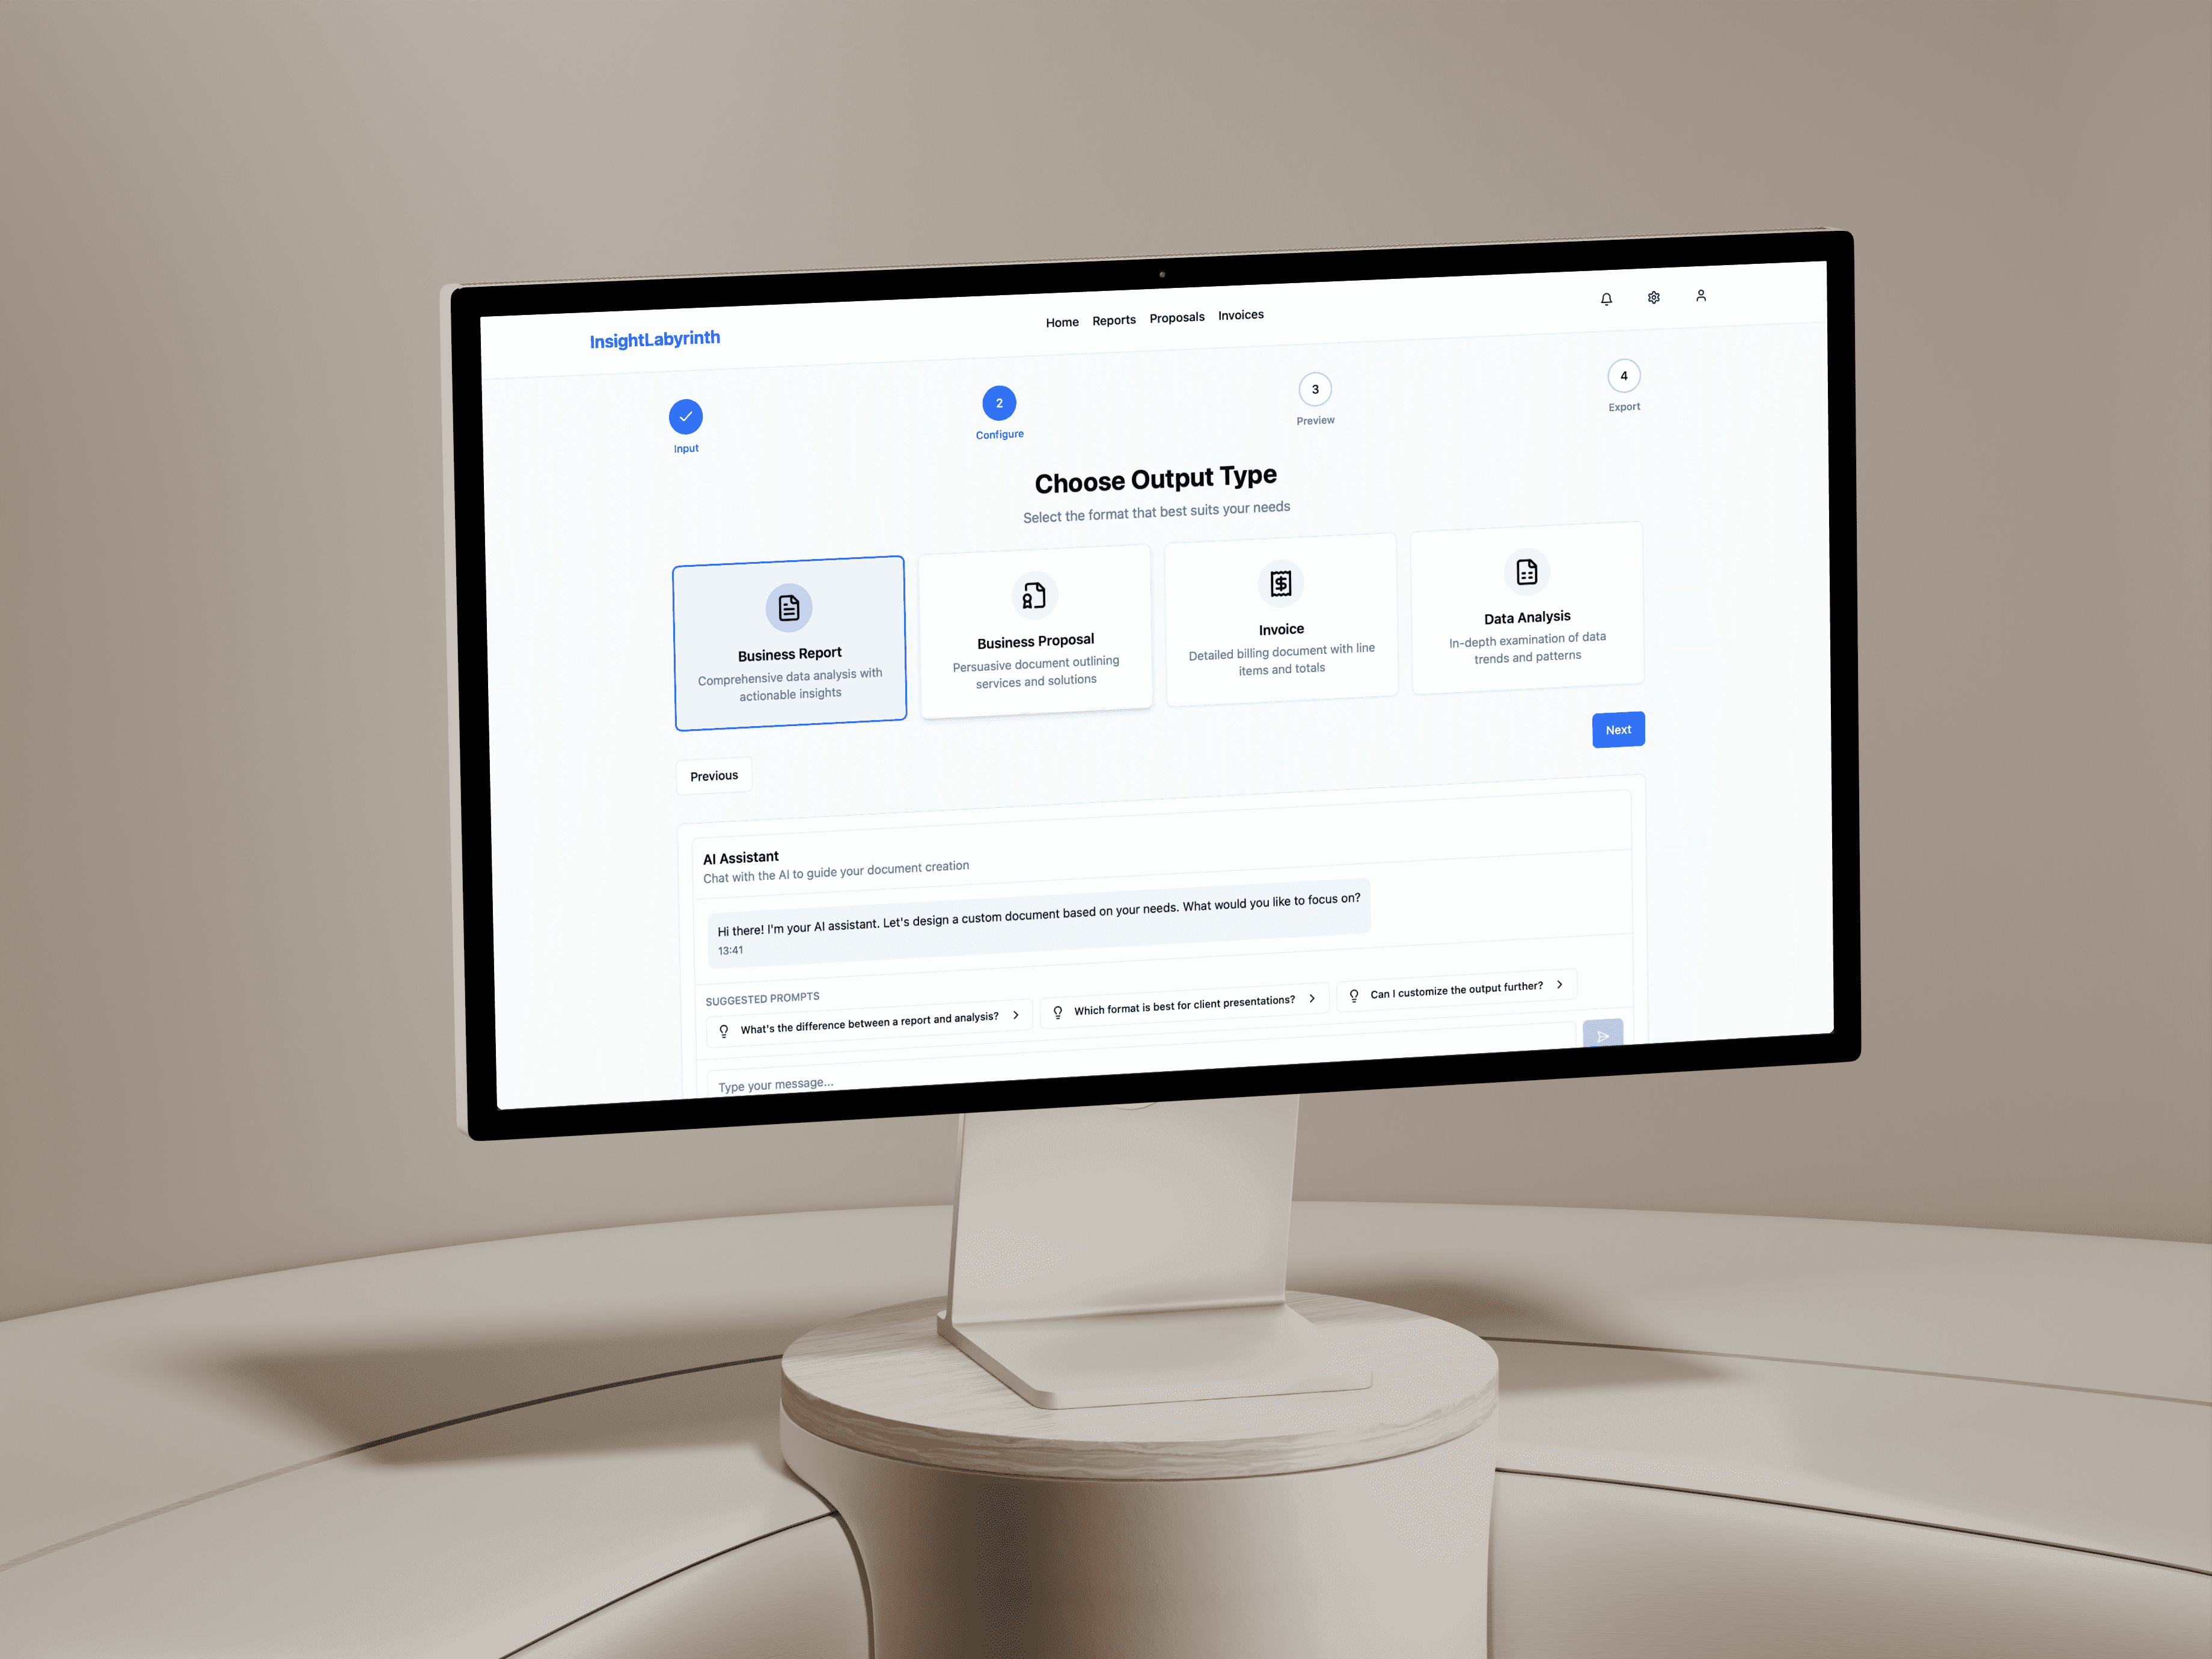
The deployed product was a 4-step wizard shell: FileUpload, OutputTypeSelector, DocumentPreview, and a chat assistant returning four hardcoded random strings. The name InsightLabyrinth implies complex, multi-path data insight navigation. What existed was a linear form with static previews rendering identical content regardless of what file was uploaded. The AIRefinements panel had 12 icon imports all aliased to Lightbulb. No confidence scoring, no schema mapping, no extraction feedback loop. The gap between what the UI claimed (an intelligent document processing engine) and what it delivered (a static preview generator) defined the brief for the feature work.

Identifying the Right Capabilities
Four features mapped directly to the document-to-document transformation pipeline. An extraction confidence panel makes visible what the AI found and how certain it is, field by field. A schema mapping view shows exactly which source text drove which output field. A processing state machine exposes the extraction pipeline as a sequence of named phases rather than a spinner. An entity graph surfaces the relational structure of the document as an interactive node canvas. Each feature has a named surface in the UI: persistent 288px right panel, standalone tab, full-screen modal overlay, and a second tab. Specific to this product category, nothing generic.

Marcus Webb
Active-Duty Infantry
Monthly subscriber, auto-reorders his bag. Earns recognition, not rewards.
Monthly Subscriber
Auto-Reorder
Merch Buyer

Lena Carr
Veteran & Firefighter
Buys for her crew. Expects double points as a service member — no questions asked.
Veteran Verified
Group Orders
Reserve Roasts
🤖
Tyler Rosch
Civilian Fan
Found BRCC through social. Driven by challenges and levelling up his rank.
Challenge Hunter
New Roasts
Squad Member

Centralised Data Layer First
Before writing any component, all AI data was defined in src/utils/aiData.ts: TypeScript interfaces for ExtractedField, EntityNode, ProcessingPhase, and DocumentHistoryItem with realistic mock values. ExtractedField carries sourceLabel, targetField, value, confidence (0 to 100), severity (ok/warning/critical), sourceSnippet, and an optional anomaly string. Separating data from components means every AI view consumes the same source of truth. Components live in src/components/AI/ keeping them isolated from the existing wizard. The default activeTab is schema, currentStep is 3, and isGenerated is pre-set to true, so the iframe opens directly to the schema mapping view with the extraction panel visible on first load.

Three Implementation Decisions
The ProcessingStateModal advances through phases autonomously. A useEffect drives an advance() closure that reads phase durations from the processingPhases array and recurses with setTimeout, tracking progress with setPhaseIndex and a boolean done flag. ExtractionPanel uses a single expanded: string | null state for accordion-style field inspection. Clicking a row toggles it open; clicking again collapses. InsightGraph renders SVG lines between absolute-positioned button nodes using percentage-based x/y coordinates. Highlighted connections (those touching the selected node) receive a 2px indigo stroke and full opacity. Unconnected nodes drop to 50% opacity, keeping visual focus on the selected entity without hiding the graph structure.
The Confidence Bar
Each ExtractedField row in ExtractionPanel.tsx renders a 4px-tall bar (h-1 in Tailwind) filled to field.confidence percent via an inline style width. The fill color maps through confidenceColor(): emerald-500 above 85, amber-400 from 60 to 84, red-500 below 60. The same threshold drives confidenceText() for the numeric label. A SeverityDot component renders the matching Lucide icon (CheckCircle2, Info, AlertTriangle) at h-3.5 w-3.5. One ExtractedField value drives four simultaneous visual signals: icon, bar color, bar length, and numeric percentage. Expanding a row reveals the source snippet in a gray block, the mapped schema field as a monospace code element, and the anomaly string in an amber-tinted border block.
What Was Shipped
The app at flowify-docs.vercel.app opens to step 3 with the schema mapping view active and the extraction panel showing 10 fields, two anomalies flagged. The Insight Graph tab renders an interactive canvas of 10 entity nodes across 6 types: document, company, person, date, amount, and concept. Clicking Generate from step 2 fires the ProcessingStateModal, which sequences through 5 named phases before landing on step 3. The aiData.ts layer means any view updates with a single data change. Adding a new document type requires only a new ExtractedField array; confidence and severity values drive all visual logic in every component across the four AI surfaces.

